Free trading journal template
A professional, self-calculating trading journal for Excel or Google Sheets — free. Log your trades once and every metric that matters updates automatically.
Free download · Updated July 2026
See what's inside
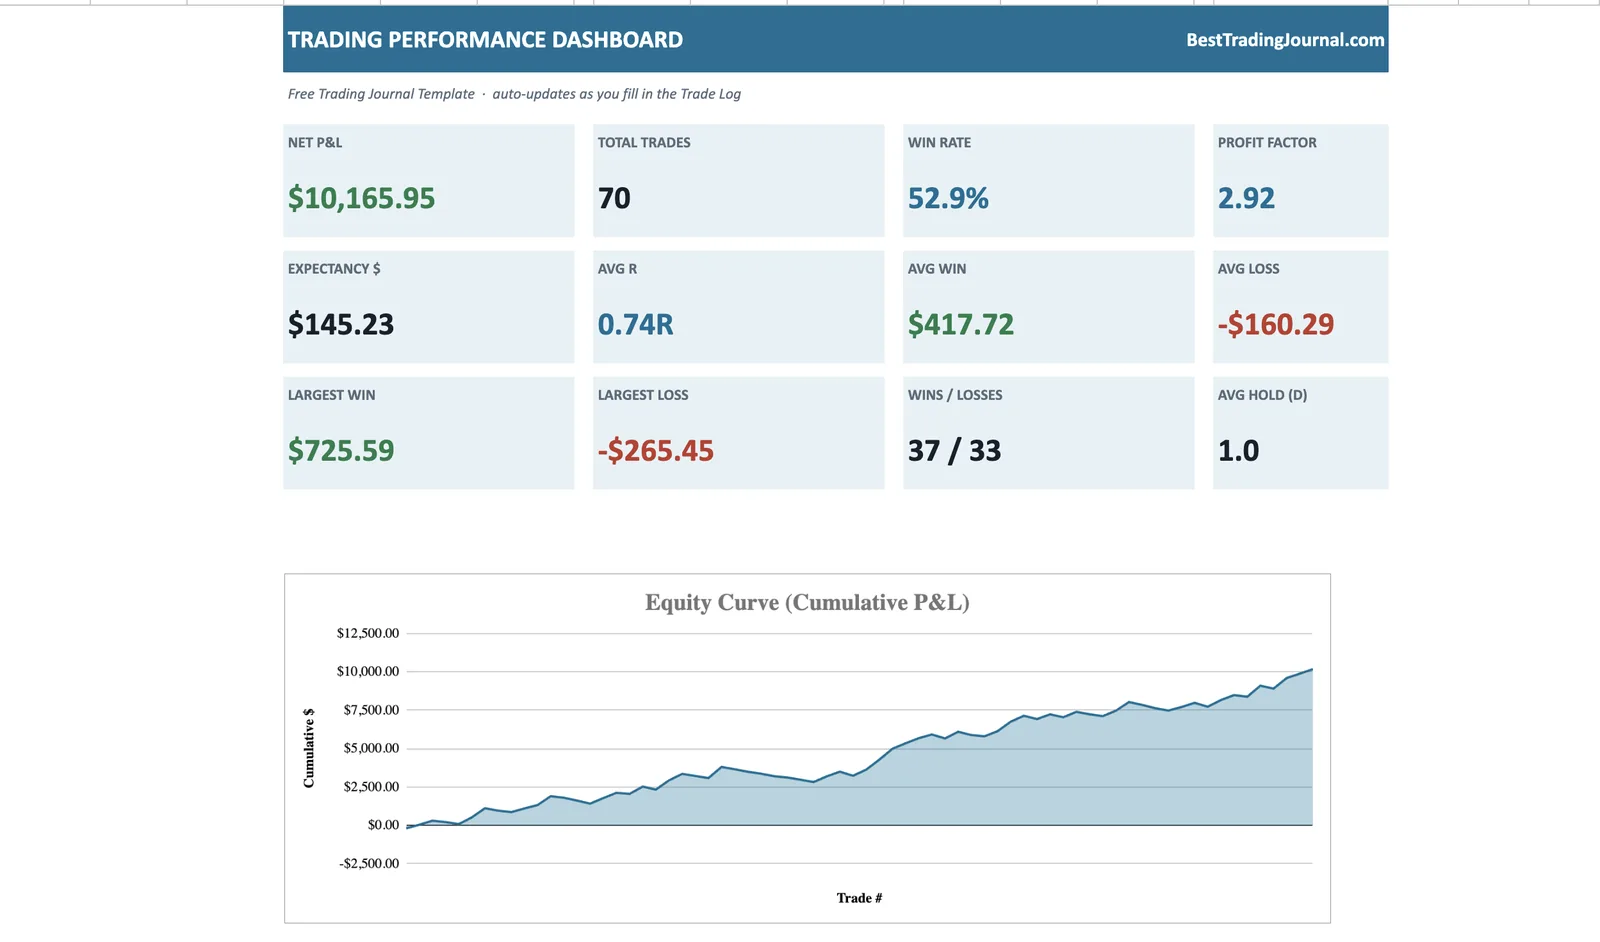
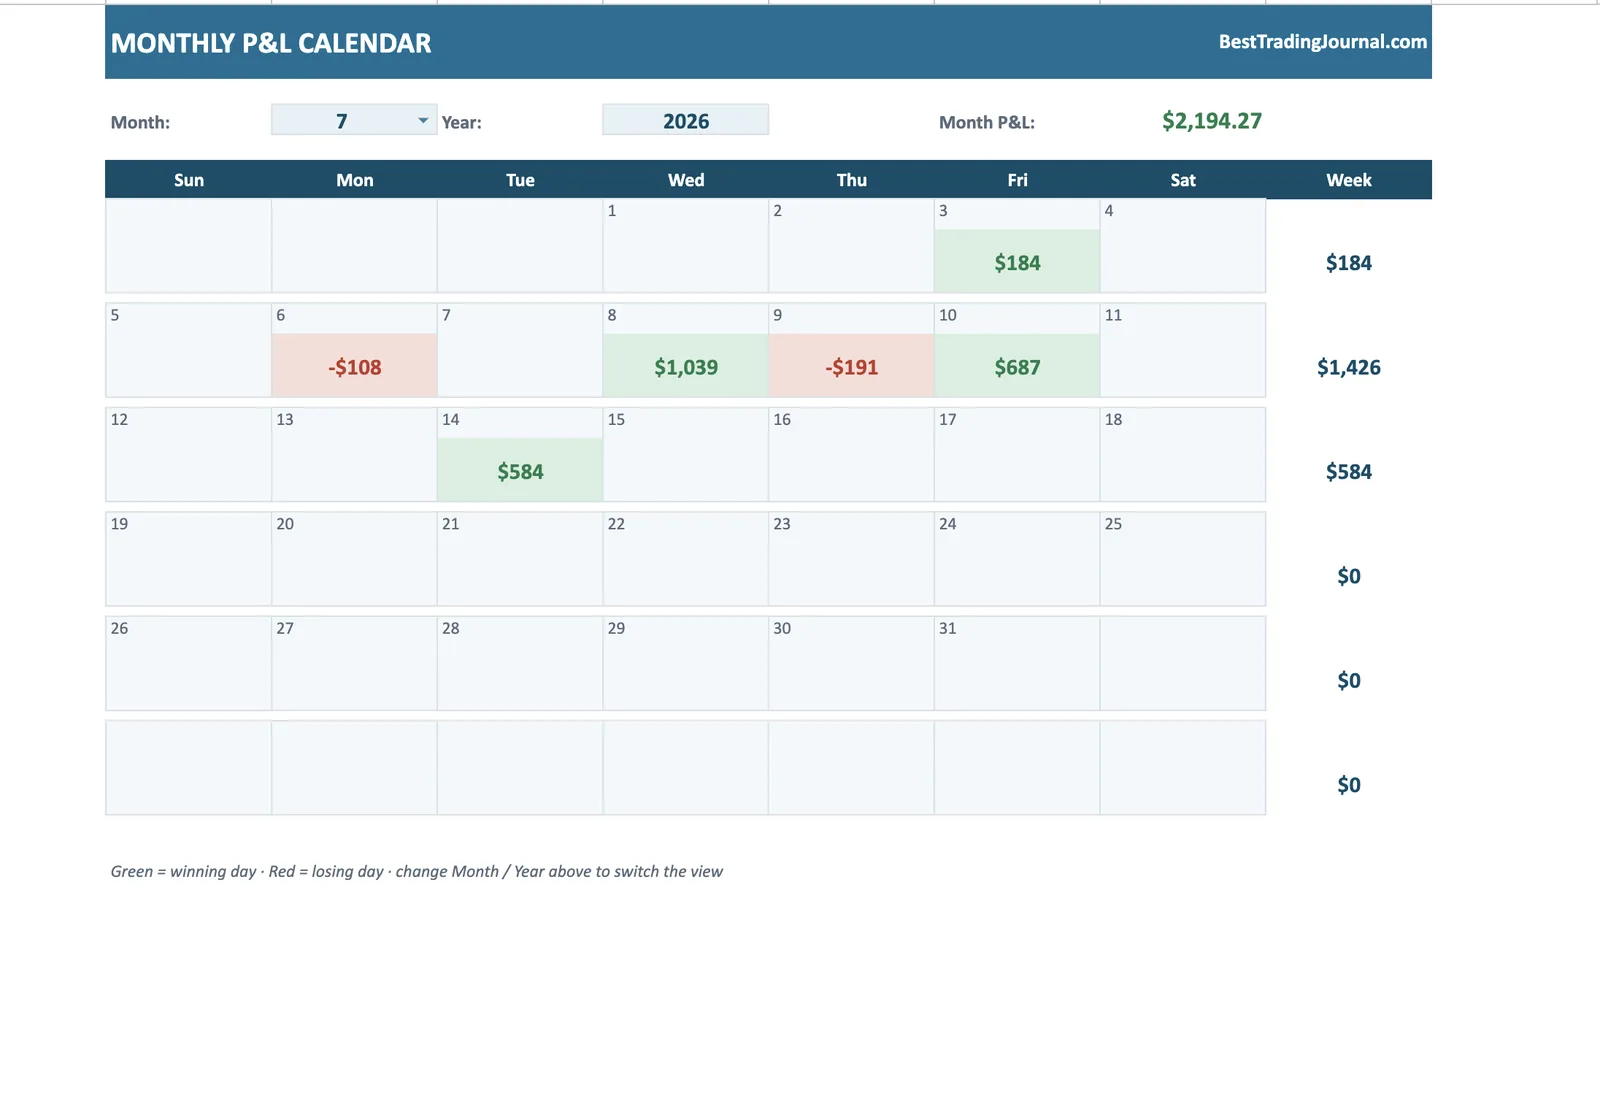
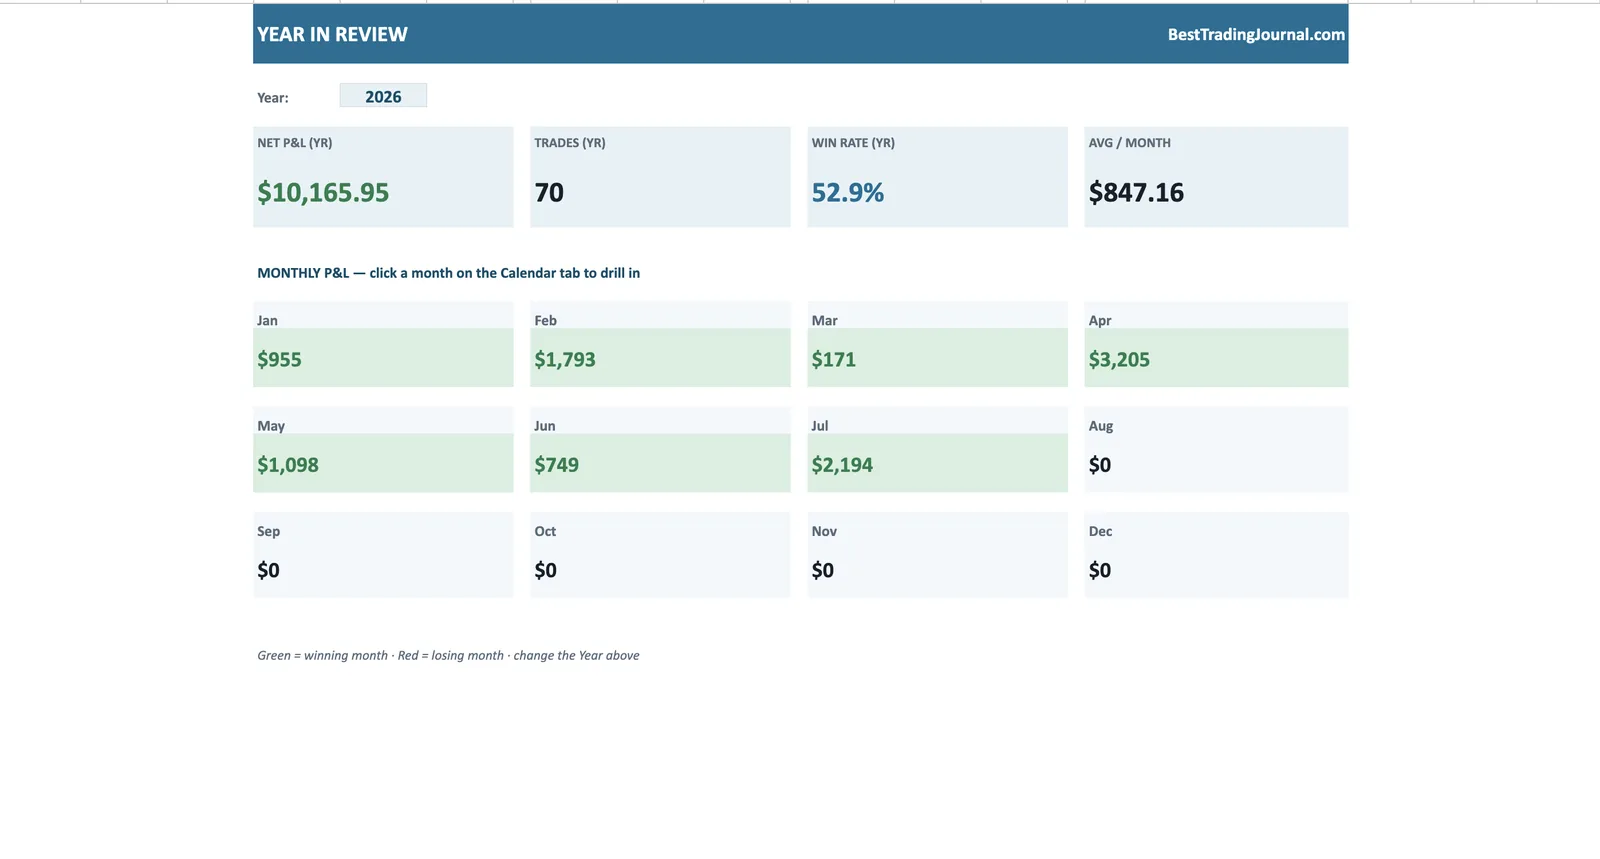
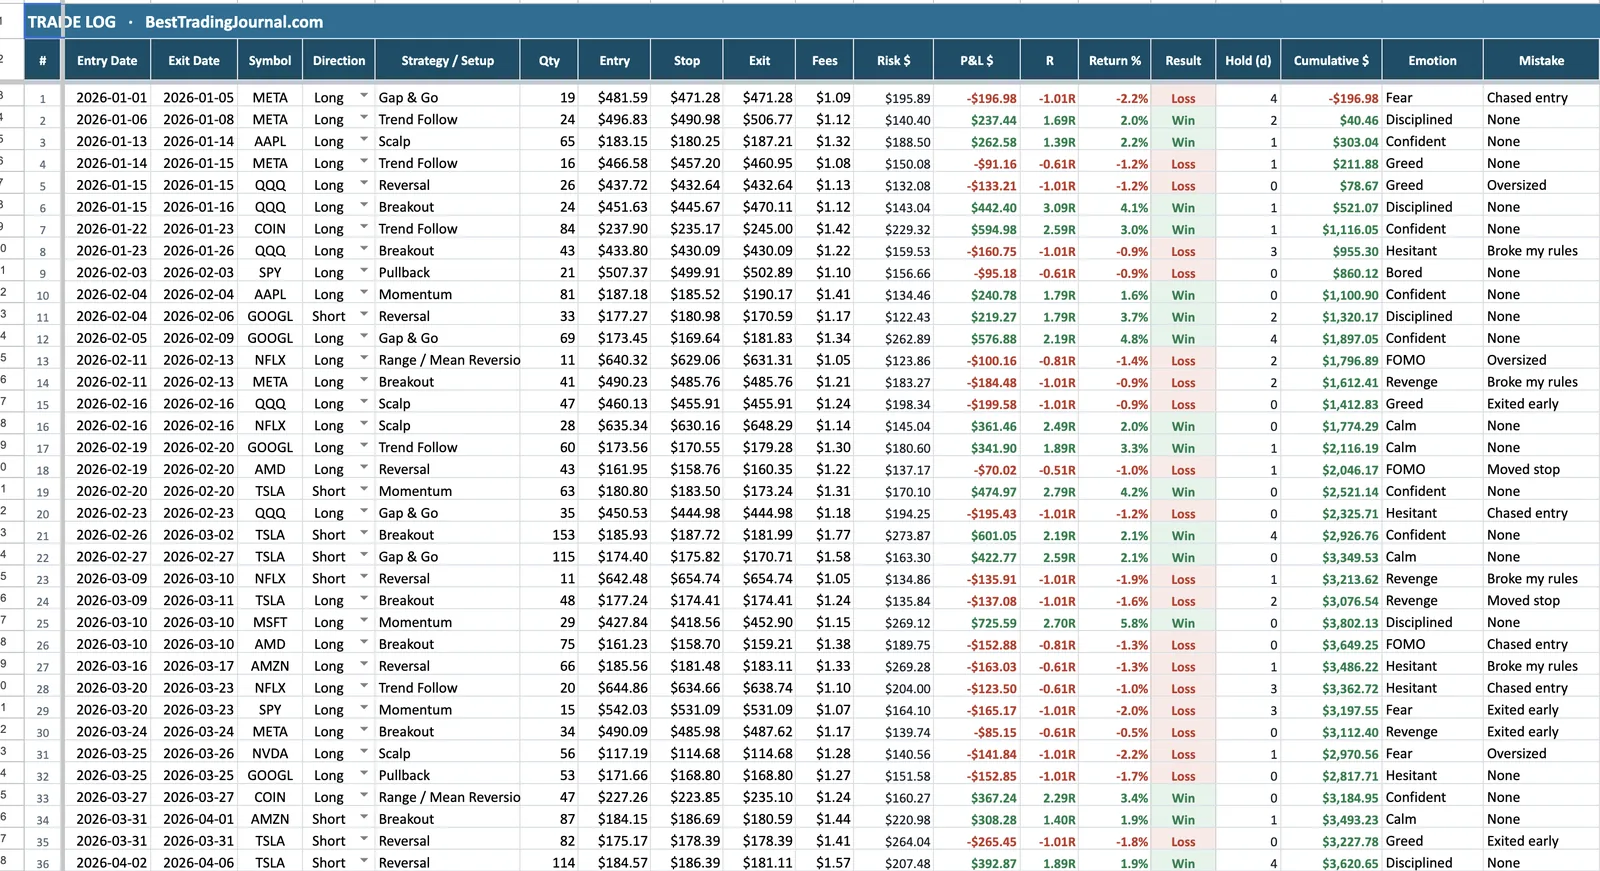
Every screenshot below is the actual file you get - dashboard, calendar and heatmap, all calculated live from your trade log.
Get the free trading journal template
Enter your email and we'll send the Excel / Google Sheets template straight to your inbox — free, no strings.
No spam. Just the template — free.
Most traders start journaling in a spreadsheet, and most give up within a month — because the free templates floating around are little more than a table of columns. They record what you did, but they don't tell you anything. No R-multiple, no expectancy, no equity curve — just data entry with nothing at the end of it.
This template is different. Fill in the white cells for each trade — date, symbol, direction, setup, size, entry, stop, exit — and it calculates your risk, P&L, R-multiple, return and running balance for you, then rolls it all up into a dashboard of the stats that actually predict whether you have an edge.
Why most free trading journal templates fall short
The typical free template gives you a grid to type trades into and, if you're lucky, a SUM of your P&L. That tells you whether you made money — not why, and not whether it will continue. The metrics that separate profitable traders from lucky ones are missing entirely.
The three that matter most are almost never included:
- R-multiple — your result measured in units of risk (P&L ÷ risk). A +2R win and a +2R win are comparable even on different position sizes; raw dollars aren't.
- Profit factor — gross profit ÷ gross loss. Above 1.5 is a real edge; below 1 you're bleeding.
- Expectancy — the average amount you can expect to make (or lose) per trade. This is the number that tells you if your system is worth trading at all.
What this template does automatically
Everything shaded on the Trade Log is a formula — you never touch it. As you add trades, the Dashboard tab updates in real time with your win rate, profit factor, expectancy, average R, average win and loss, and your biggest winner and loser.
You also get five live charts and a monthly P&L calendar, so you can see your equity curve trending up (or not), which strategies actually make money, and which days of the month you tend to give it back.
How to use it
Open it in Excel or Google Sheets, delete the 40 sample trades that ship with it (they're there so you can see it working), and start logging your own. The formulas stay intact.
When your spreadsheet starts to creak — hundreds of trades, wanting automatic broker sync and trade replay — that's the signal to move to dedicated software. We rank the best options for exactly that moment.
Outgrown the spreadsheet? Try TradeOlogy
When the spreadsheet starts feeling small, the step up is automatic: broker sync, customizable dashboards and a trade simulator - with a free tier that keeps the price of curiosity at zero.
Keep reading
Free Trading Journal Template — FAQ
Is this trading journal template really free?
Yes — enter your email and we send it to you free. No trial, no card, no upsell. It works in Excel or Google Sheets forever.
Does it work in both Excel and Google Sheets?
Yes. It's built on standard formulas (no macros), so it opens and calculates correctly in Microsoft Excel and in Google Sheets.
What do I actually have to type in?
Only the white input columns: dates, symbol, direction, setup, quantity, entry, stop, exit and fees. Risk, P&L, R-multiple, return, result and your running balance are all calculated for you.
Will it work with my broker?
Yes — it's broker-agnostic. Log trades manually, or paste in a CSV export from any broker. Nothing is locked to a specific platform.