
Ranked #1 of 5 · Reviewed July 2026
TradeOlogy Review
Broker auto-sync, a fully customizable analytics dashboard, and a built-in trade simulator - at roughly half the price of the big names.

Quick verdict
TradeOlogy quietly out-specs journals that cost twice as much. The free tier is the most generous we tested, the paid tiers undercut the market, and the combination of auto-sync, a customizable dashboard and a risk-free simulator is hard to beat at any price. It is our top pick for 2026.
What is TradeOlogy?
TradeOlogy is an automated trading journal and performance-analytics platform for active traders. It connects to your broker, imports every fill, and turns your raw trade history into a live dashboard of the numbers that actually decide whether you survive: net P&L, win rate, expectancy, profit factor and drawdown. The idea is simple - you trade, and the journal keeps itself.
Where it stands out is breadth. Most journals do one or two things well; TradeOlogy bundles broker auto-sync, a fully customizable dashboard, six report categories, a color-coded trading calendar, per-strategy analytics, a rich journaling notebook, a built-in trade simulator, tax reporting and a free trading academy into a single, clean workspace. It handles stocks, options, futures and crypto in the same account.
And it does all of this at a price that undercuts the better-known names - a genuinely free forever tier, then paid plans from $15/month. That combination of depth and value is why it sits at the top of our 2026 rankings.
Key features
Automatic broker sync - the journal fills itself in
TradeOlogy auto-syncs from 25+ brokers, so every trade lands in your journal without a single manual entry. Positions, fills, fees and multi-leg options orders are reconciled to your account, which means the numbers you review actually match your statements to the cent.
If your broker isn't directly supported, CSV import covers the rest - you can bring in a full trade history from anywhere. Either way, your holdings, allocation and P&L stay current on their own. Removing that friction is the single biggest reason people who start a journal here actually keep it.

One dashboard for every market
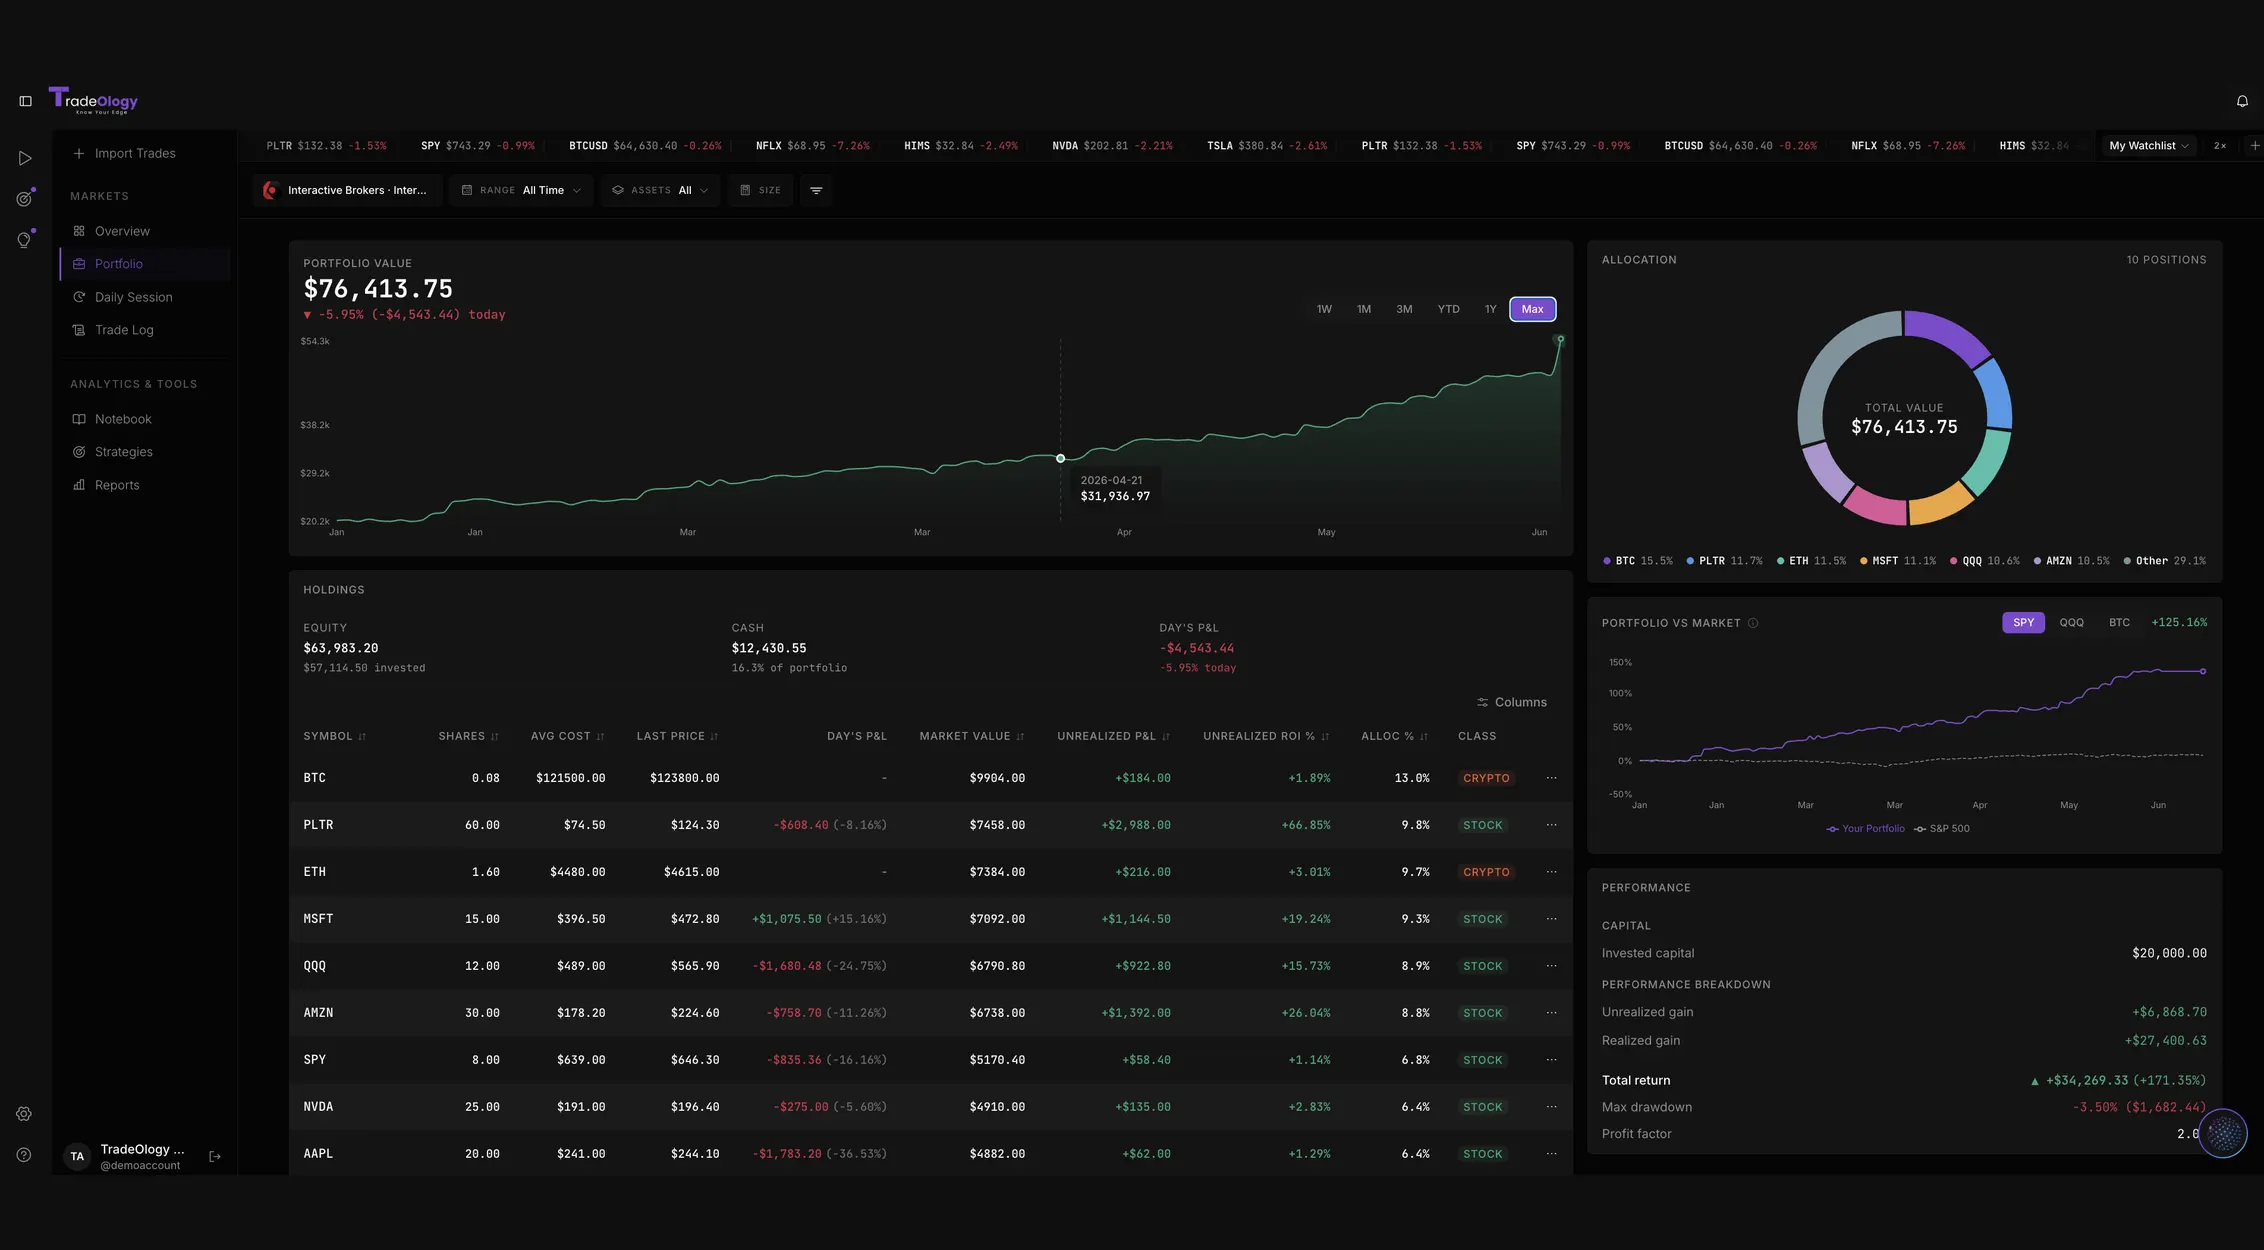
The Overview is a build-your-own dashboard. Net P&L, profit factor, expectancy, a daily P&L histogram, a cumulative equity curve, recent trades and the trading calendar all sit on one screen, and you can arrange it around the metrics you personally care about.
Because stocks, options, futures and crypto all live in the same journal, you finally get one honest picture of your trading instead of a different spreadsheet for each account.
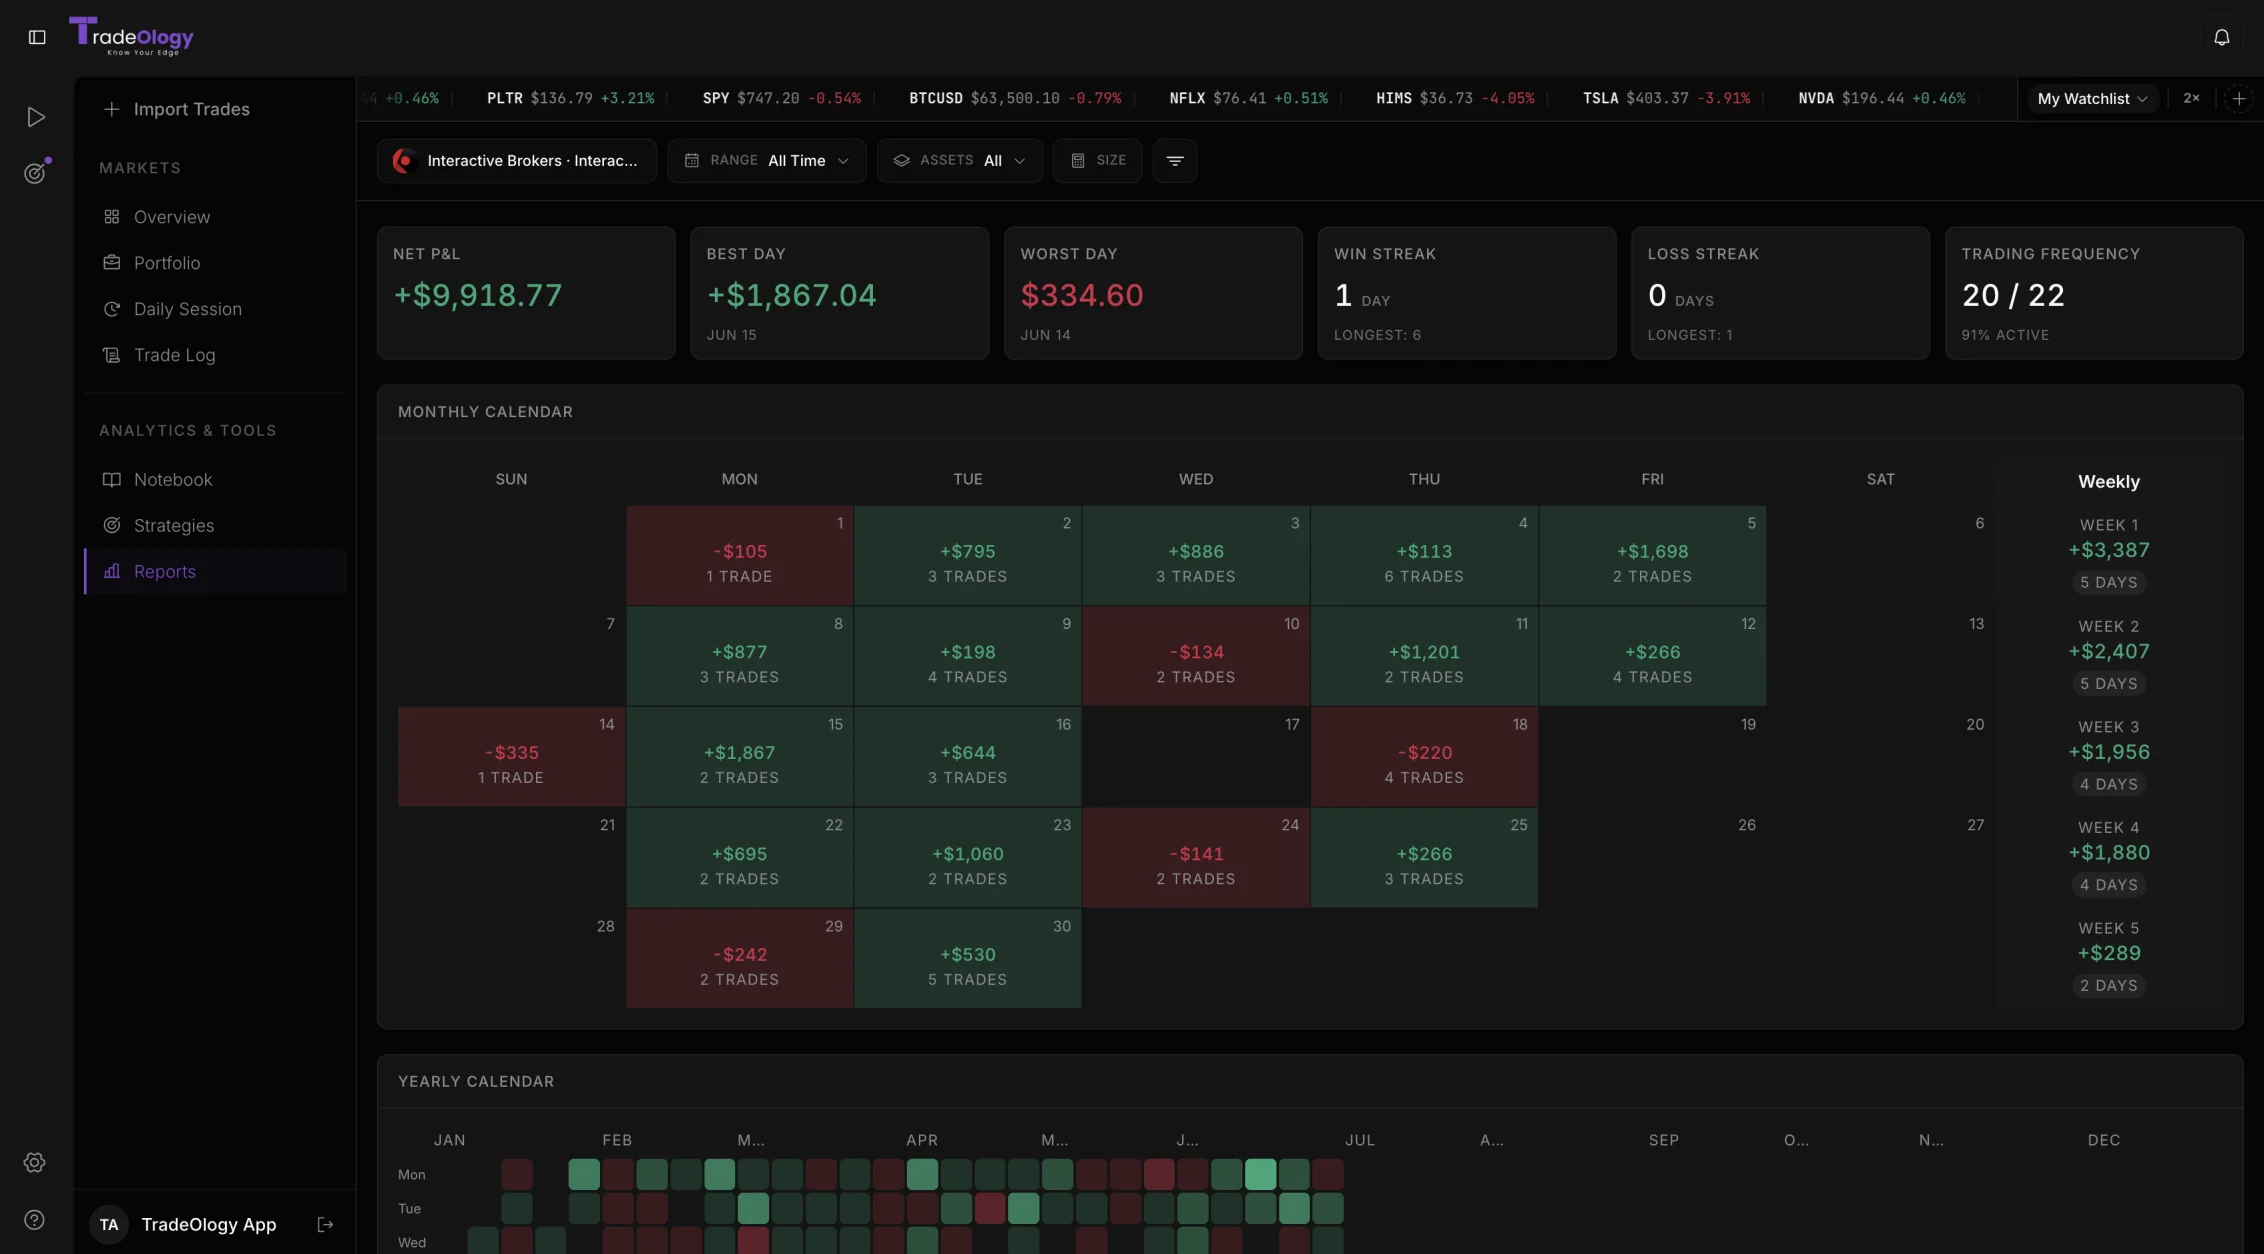
A color-coded trading calendar
The calendar turns your month into an at-a-glance heatmap: green days, red days, trade counts and weekly totals, with a yearly view underneath that shows your consistency across the whole year.
It sounds simple, but seeing a losing streak form as a block of red is far more visceral - and far more useful - than reading it off a table. It's the fastest way to spot the patterns your memory quietly edits out.
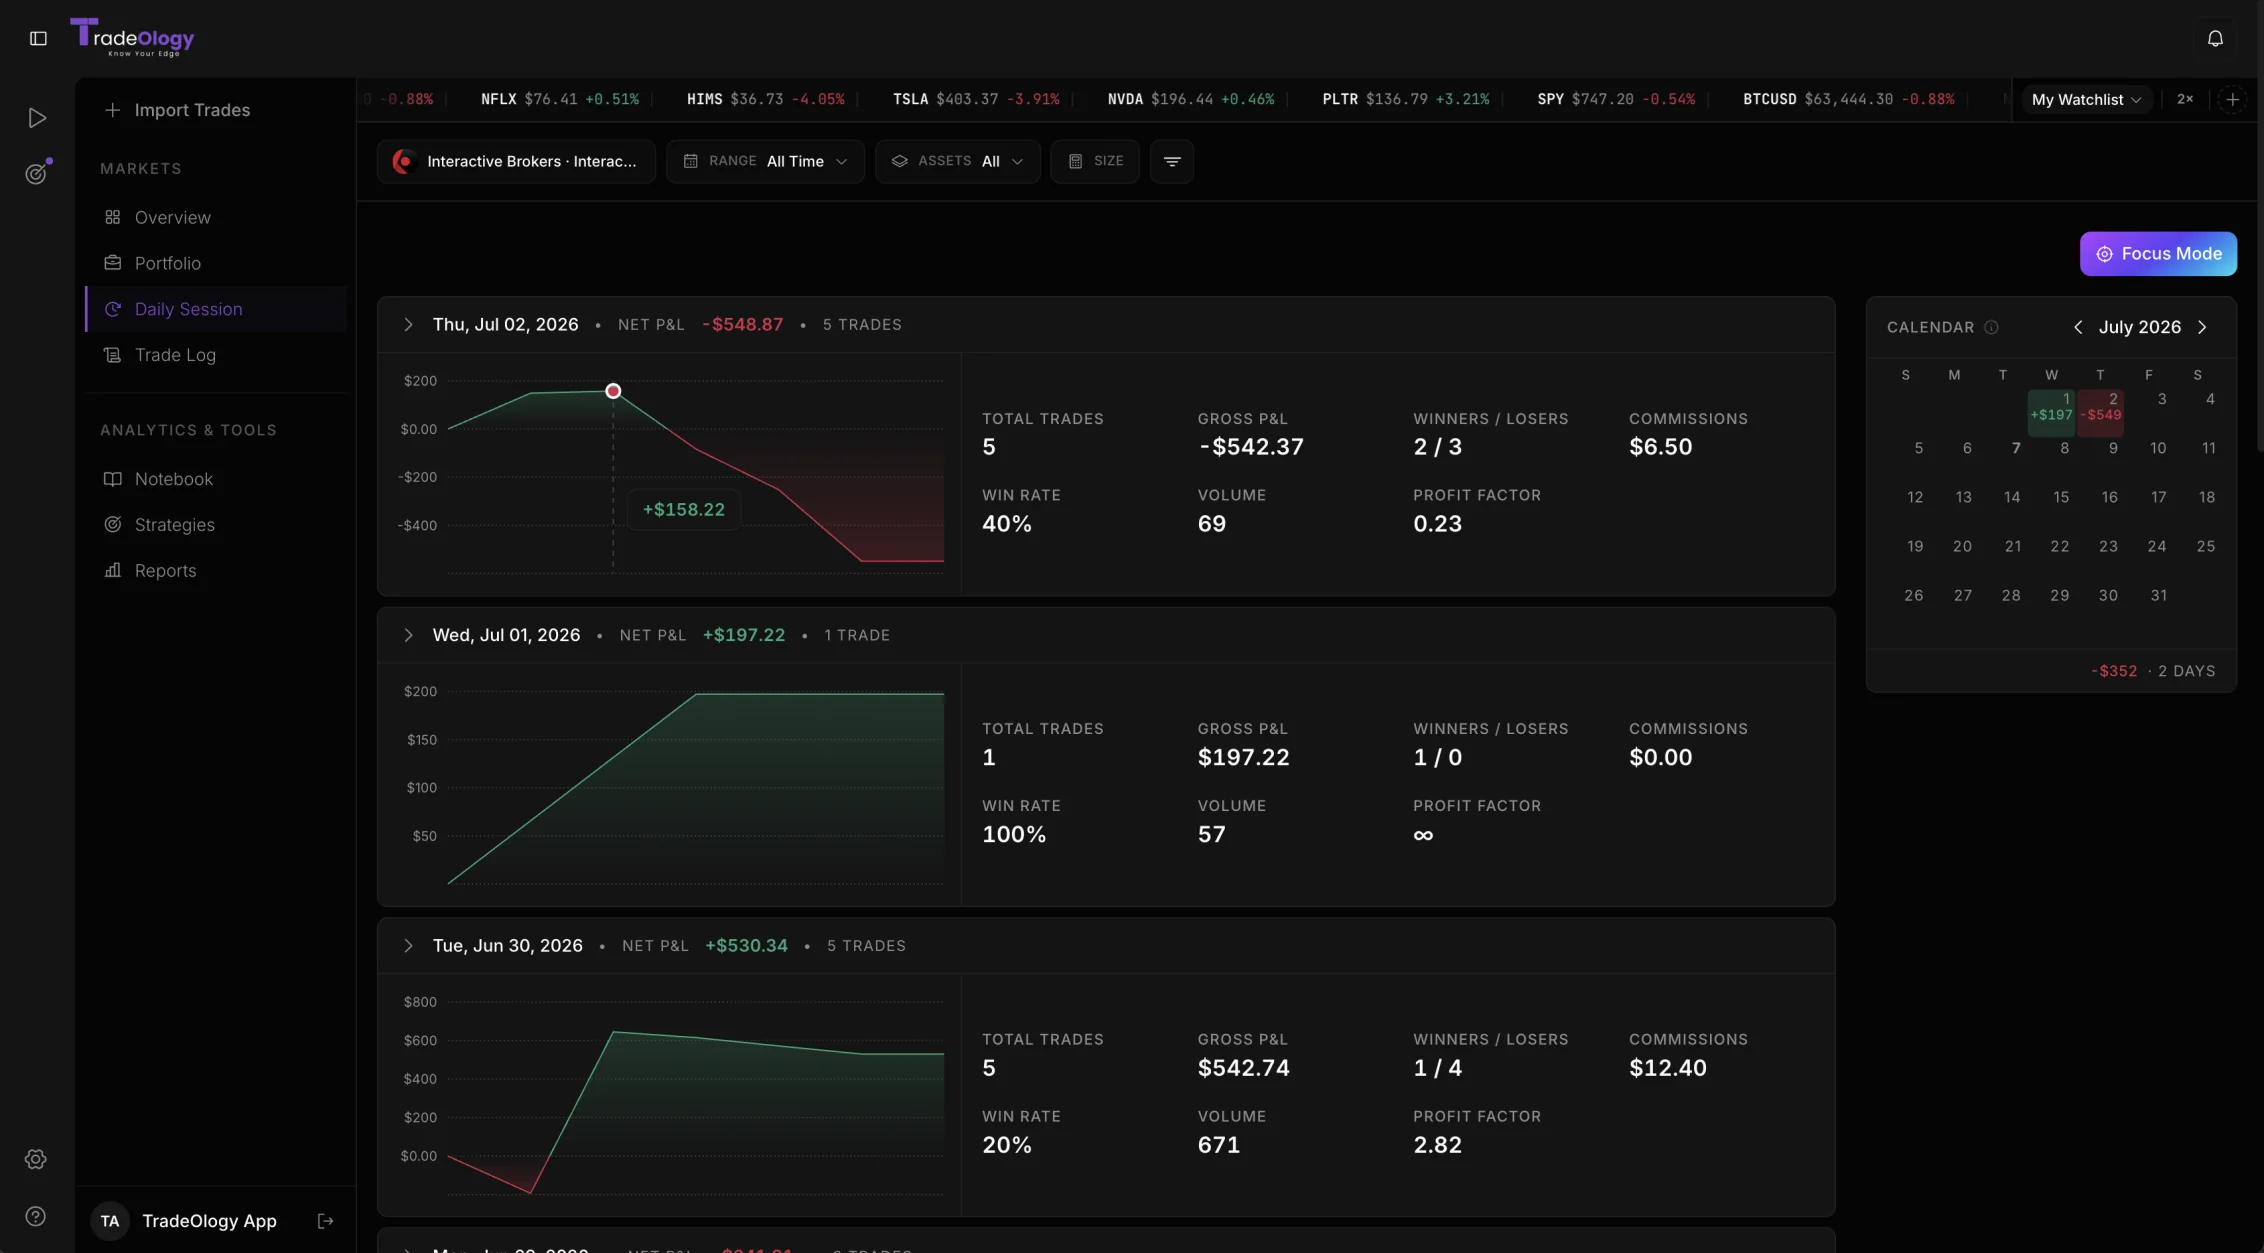
Daily session reviews
Each trading day gets its own session view - the day's P&L curve, win rate, profit factor, volume and commissions in one compact card. It turns the end-of-day review from a vague memory into a structured, two-minute habit.
For active traders taking dozens of trades a week, this is where the real learning happens: a fast, repeatable ritual that keeps you honest about how you actually executed, not just whether the day was green.
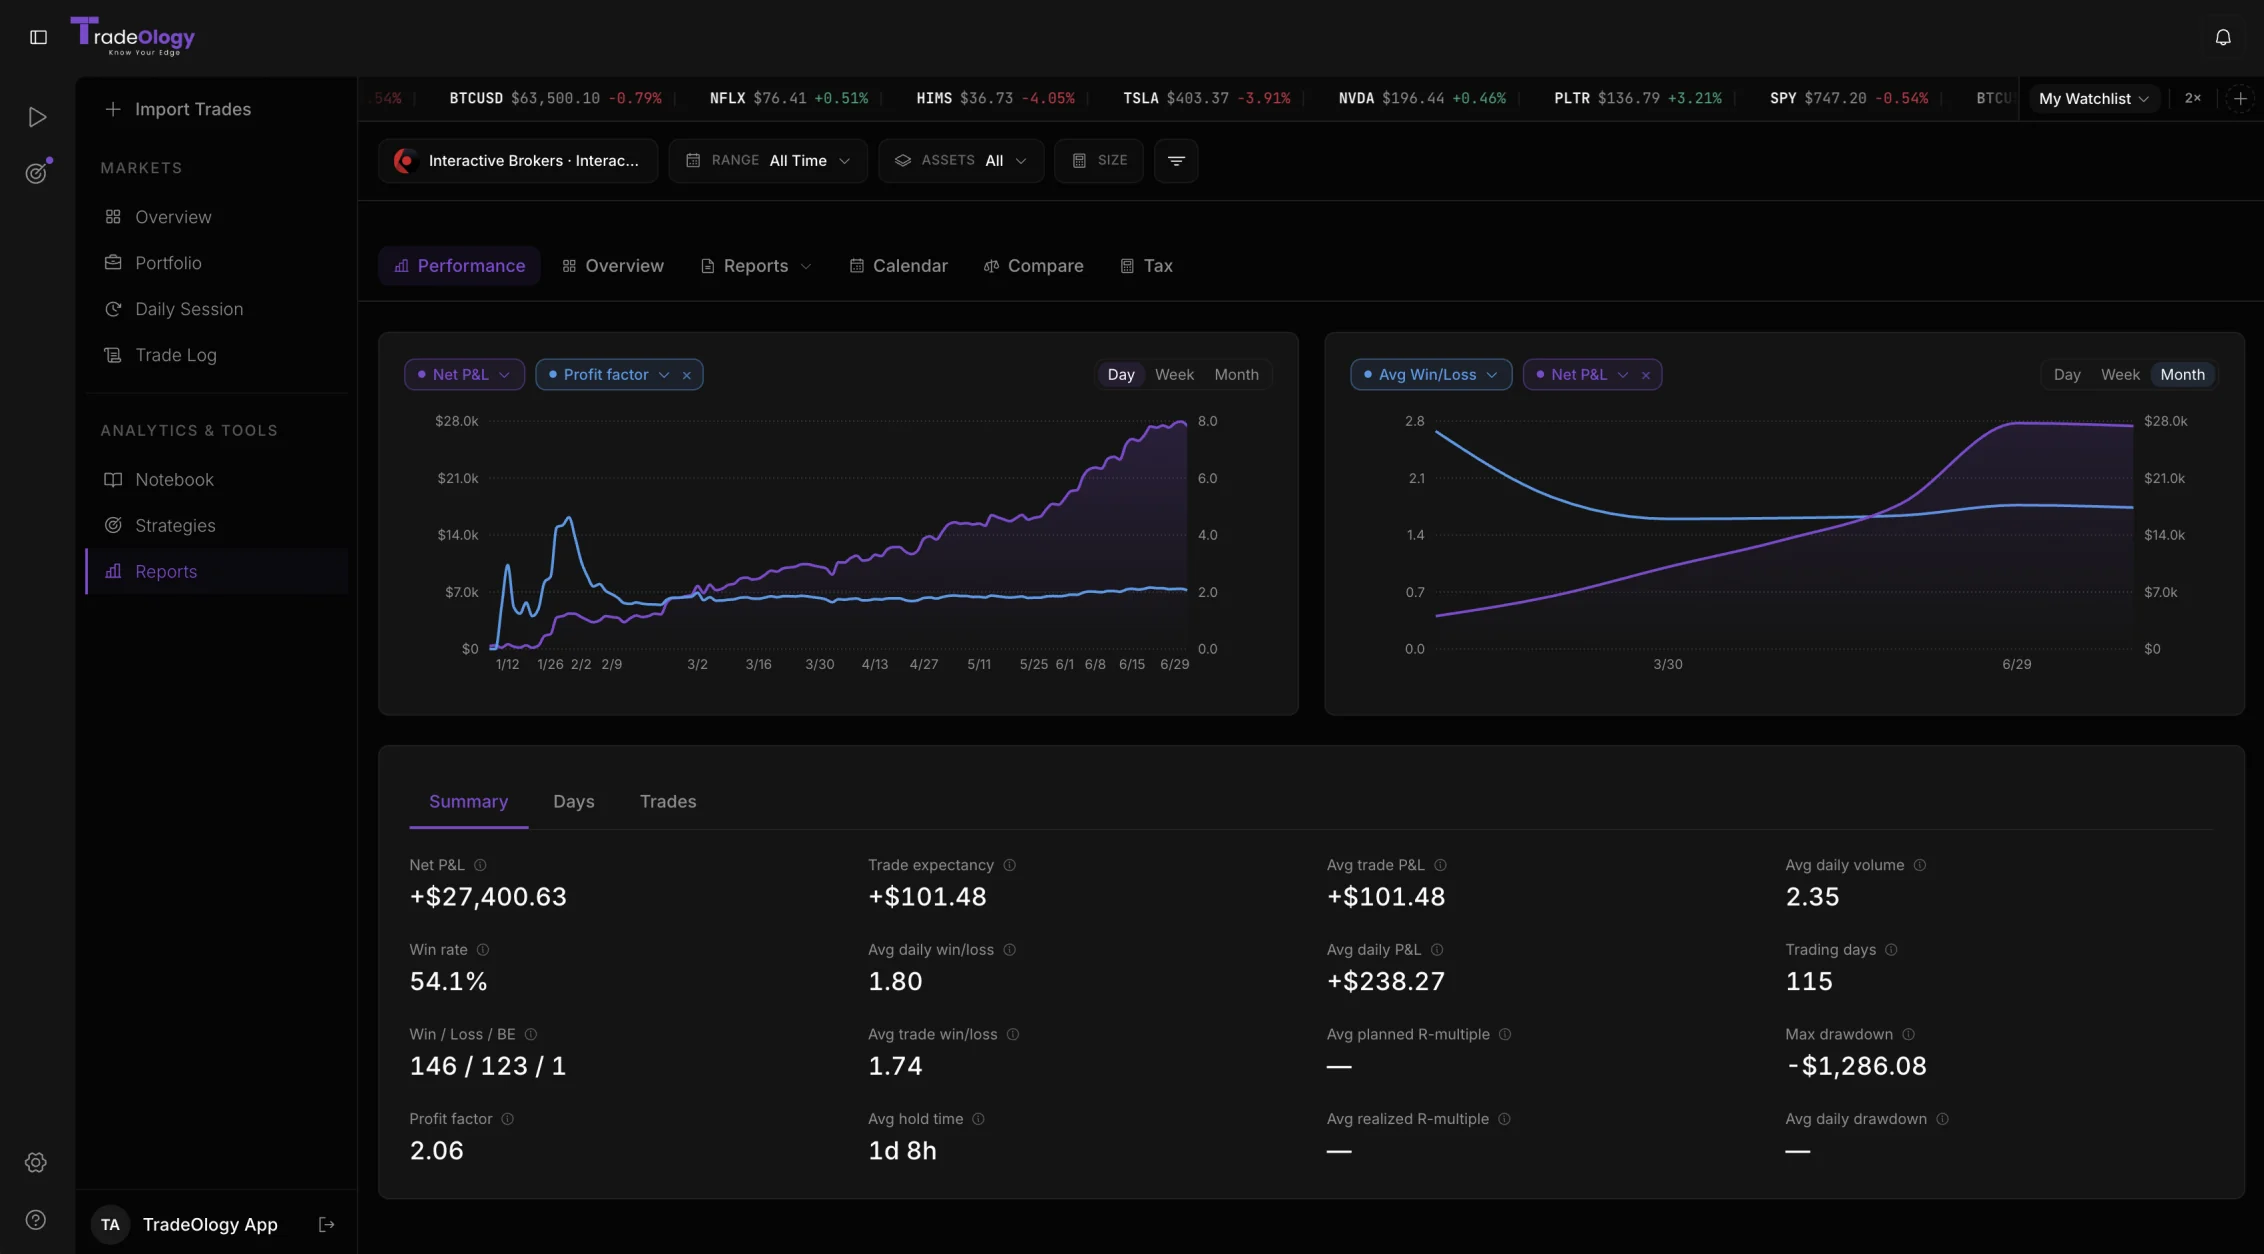
Six report categories, built for decisions
Under Reports you get six categories - performance, risk, time, tags, symbols and cashflow - that go well past vanity metrics into expectancy, profit factor, average win versus average loss, hold time and drawdown.
The point isn't to admire charts; it's to decide. The reports make it obvious which setups deserve more capital, which are quietly bleeding the account, and where your real edge is coming from.
Insights that surface your hidden leaks
Beyond the raw numbers, TradeOlogy writes plain-language insights on top of your data - flagging that Monday drives a third of your total P&L, or that a particular day of the week or time window is quietly costing you.
The day-of-week and time-of-day reports are especially valuable for intraday traders: discovering that your first 30 minutes are net negative, or that one session carries your whole month, can change your P&L overnight.

Per-strategy and per-setup analytics
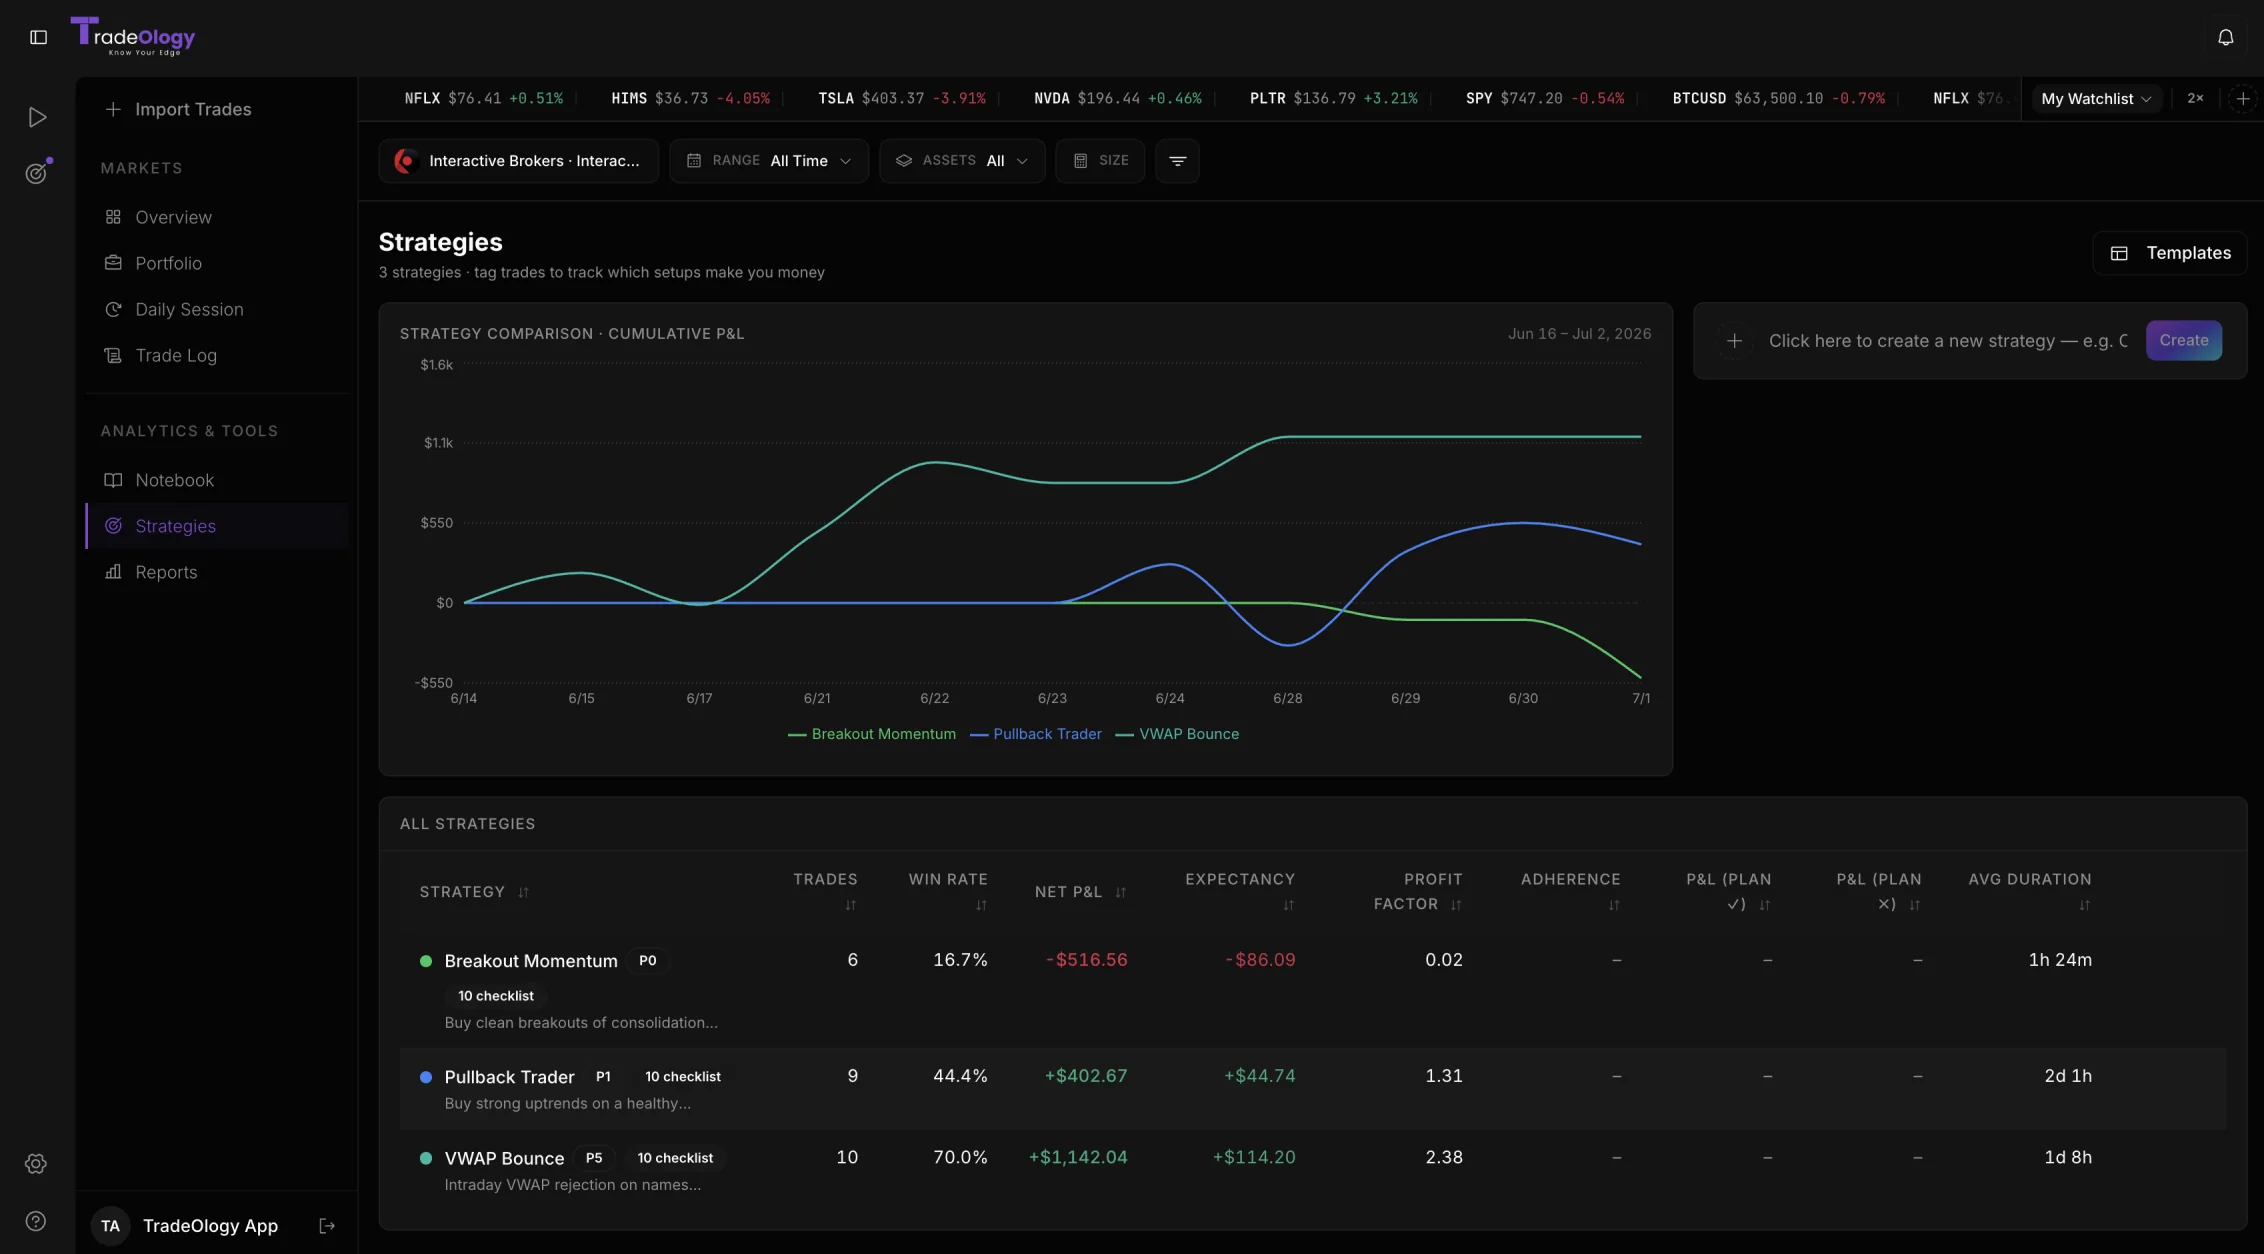
Tag each trade with its strategy - VWAP bounce, breakout, pullback, earnings - and TradeOlogy tracks win rate, expectancy, profit factor and average duration for each one, then compares their cumulative P&L side by side.
Drill into any single strategy for its own equity curve, plan-adherence stats and full trade list. Knowing which of your setups actually makes money - and cutting the ones that don't - is one of the highest-leverage things a journal can show you.
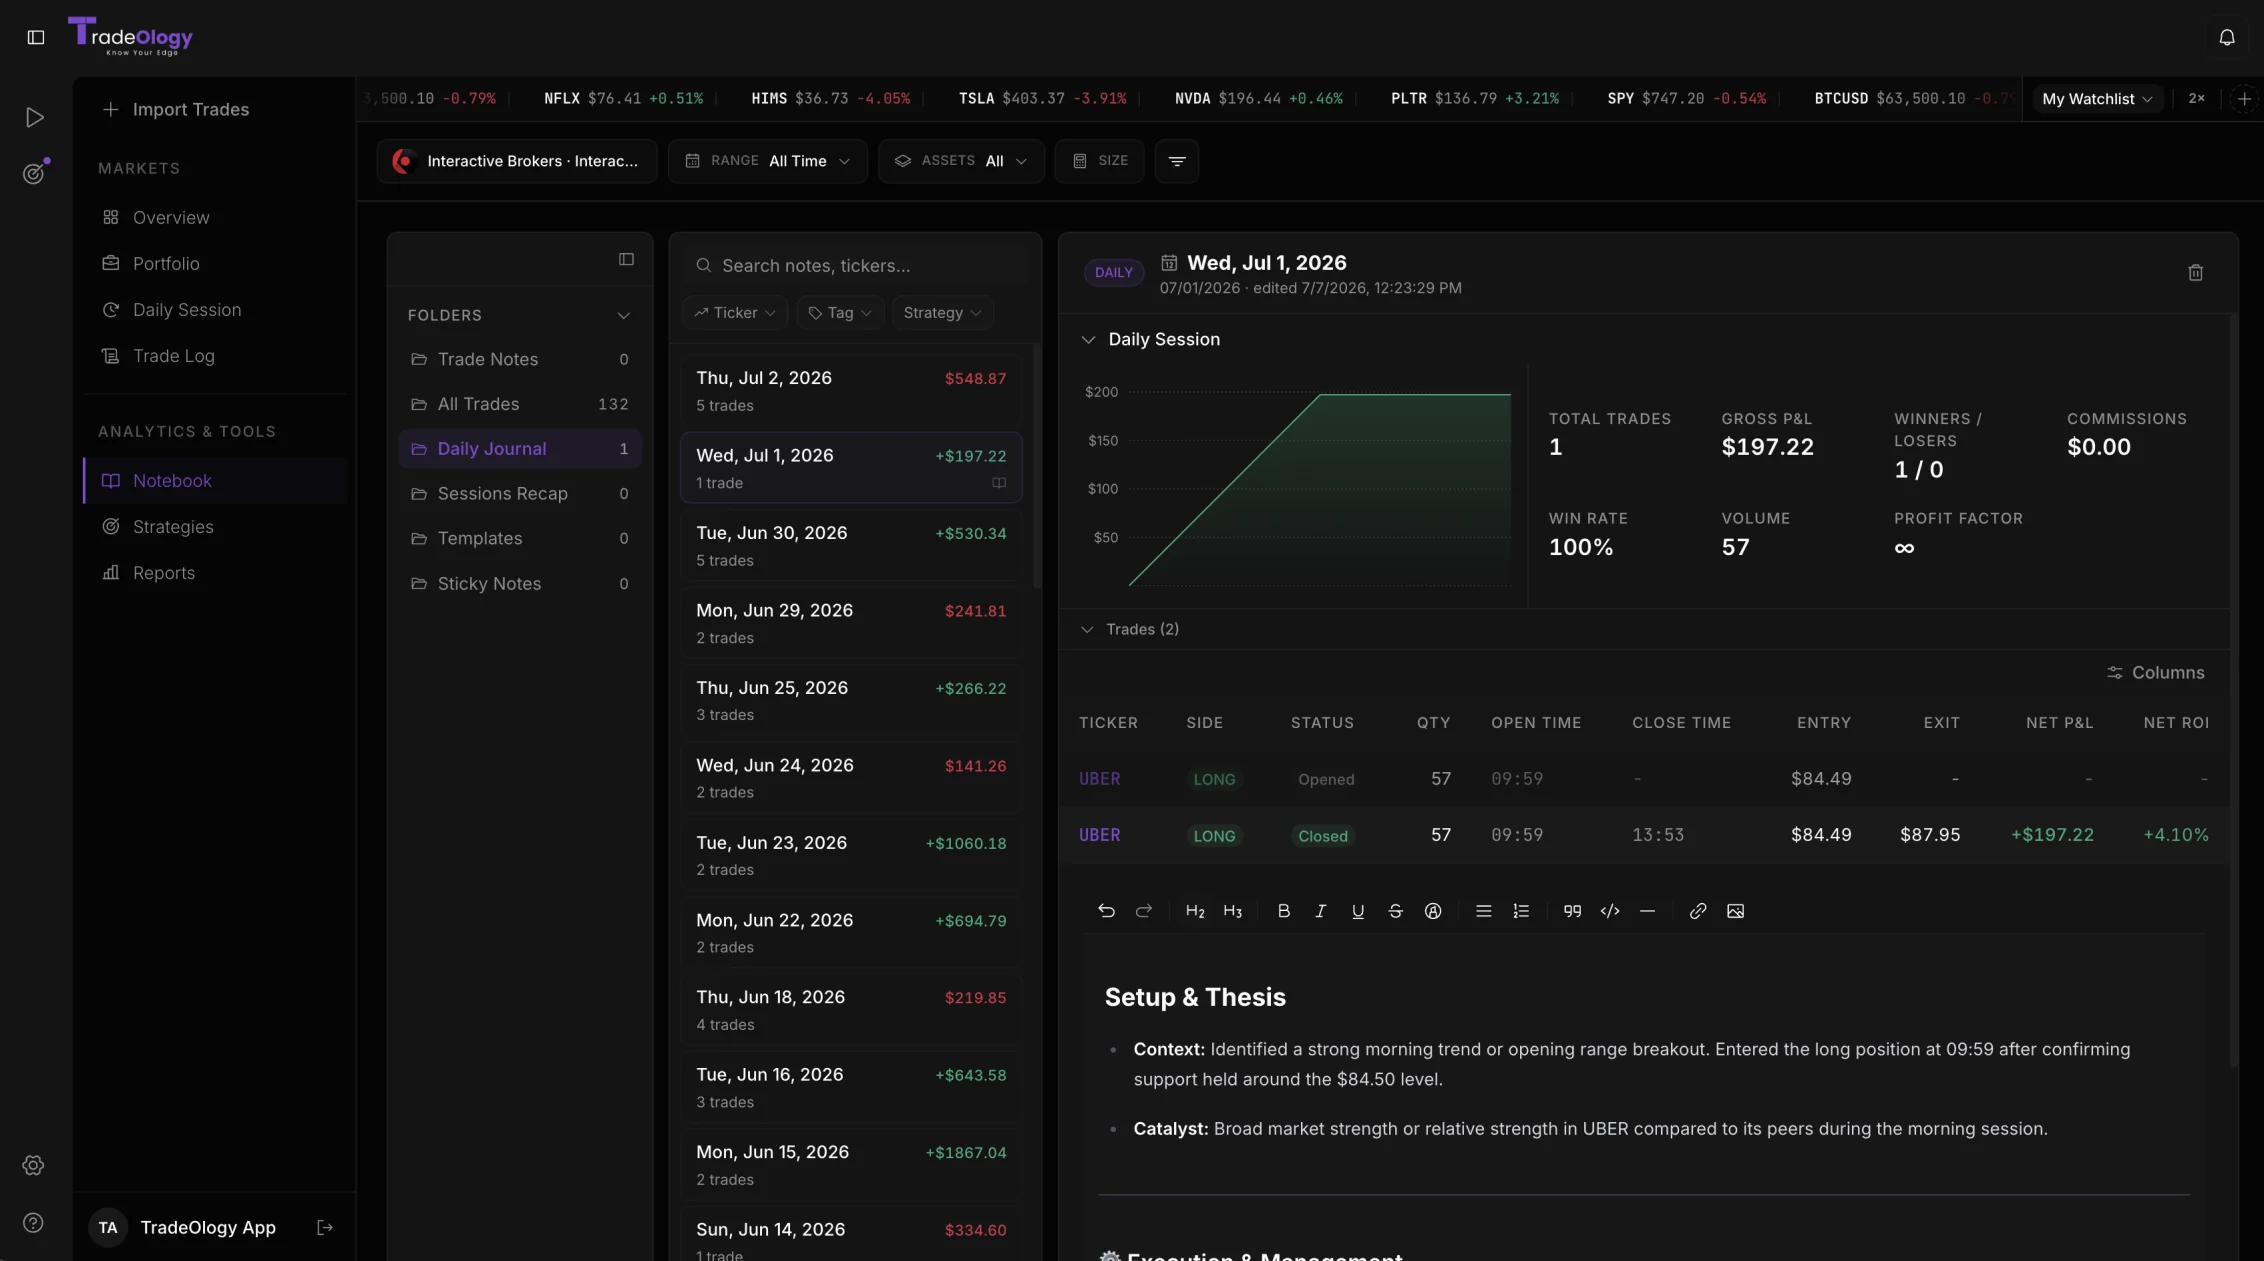
A notebook and journal, right next to your stats
The Notebook pairs a dated, searchable journal with each trading day's numbers. You can write your setup thesis, attach screenshots, tag emotions and mistakes, and keep templates and sticky notes - all beside the P&L that day produced.
That pairing of narrative and numbers is where the real growth happens. Metrics tell you a pattern exists; your notes tell you why, and what to do about it next time.
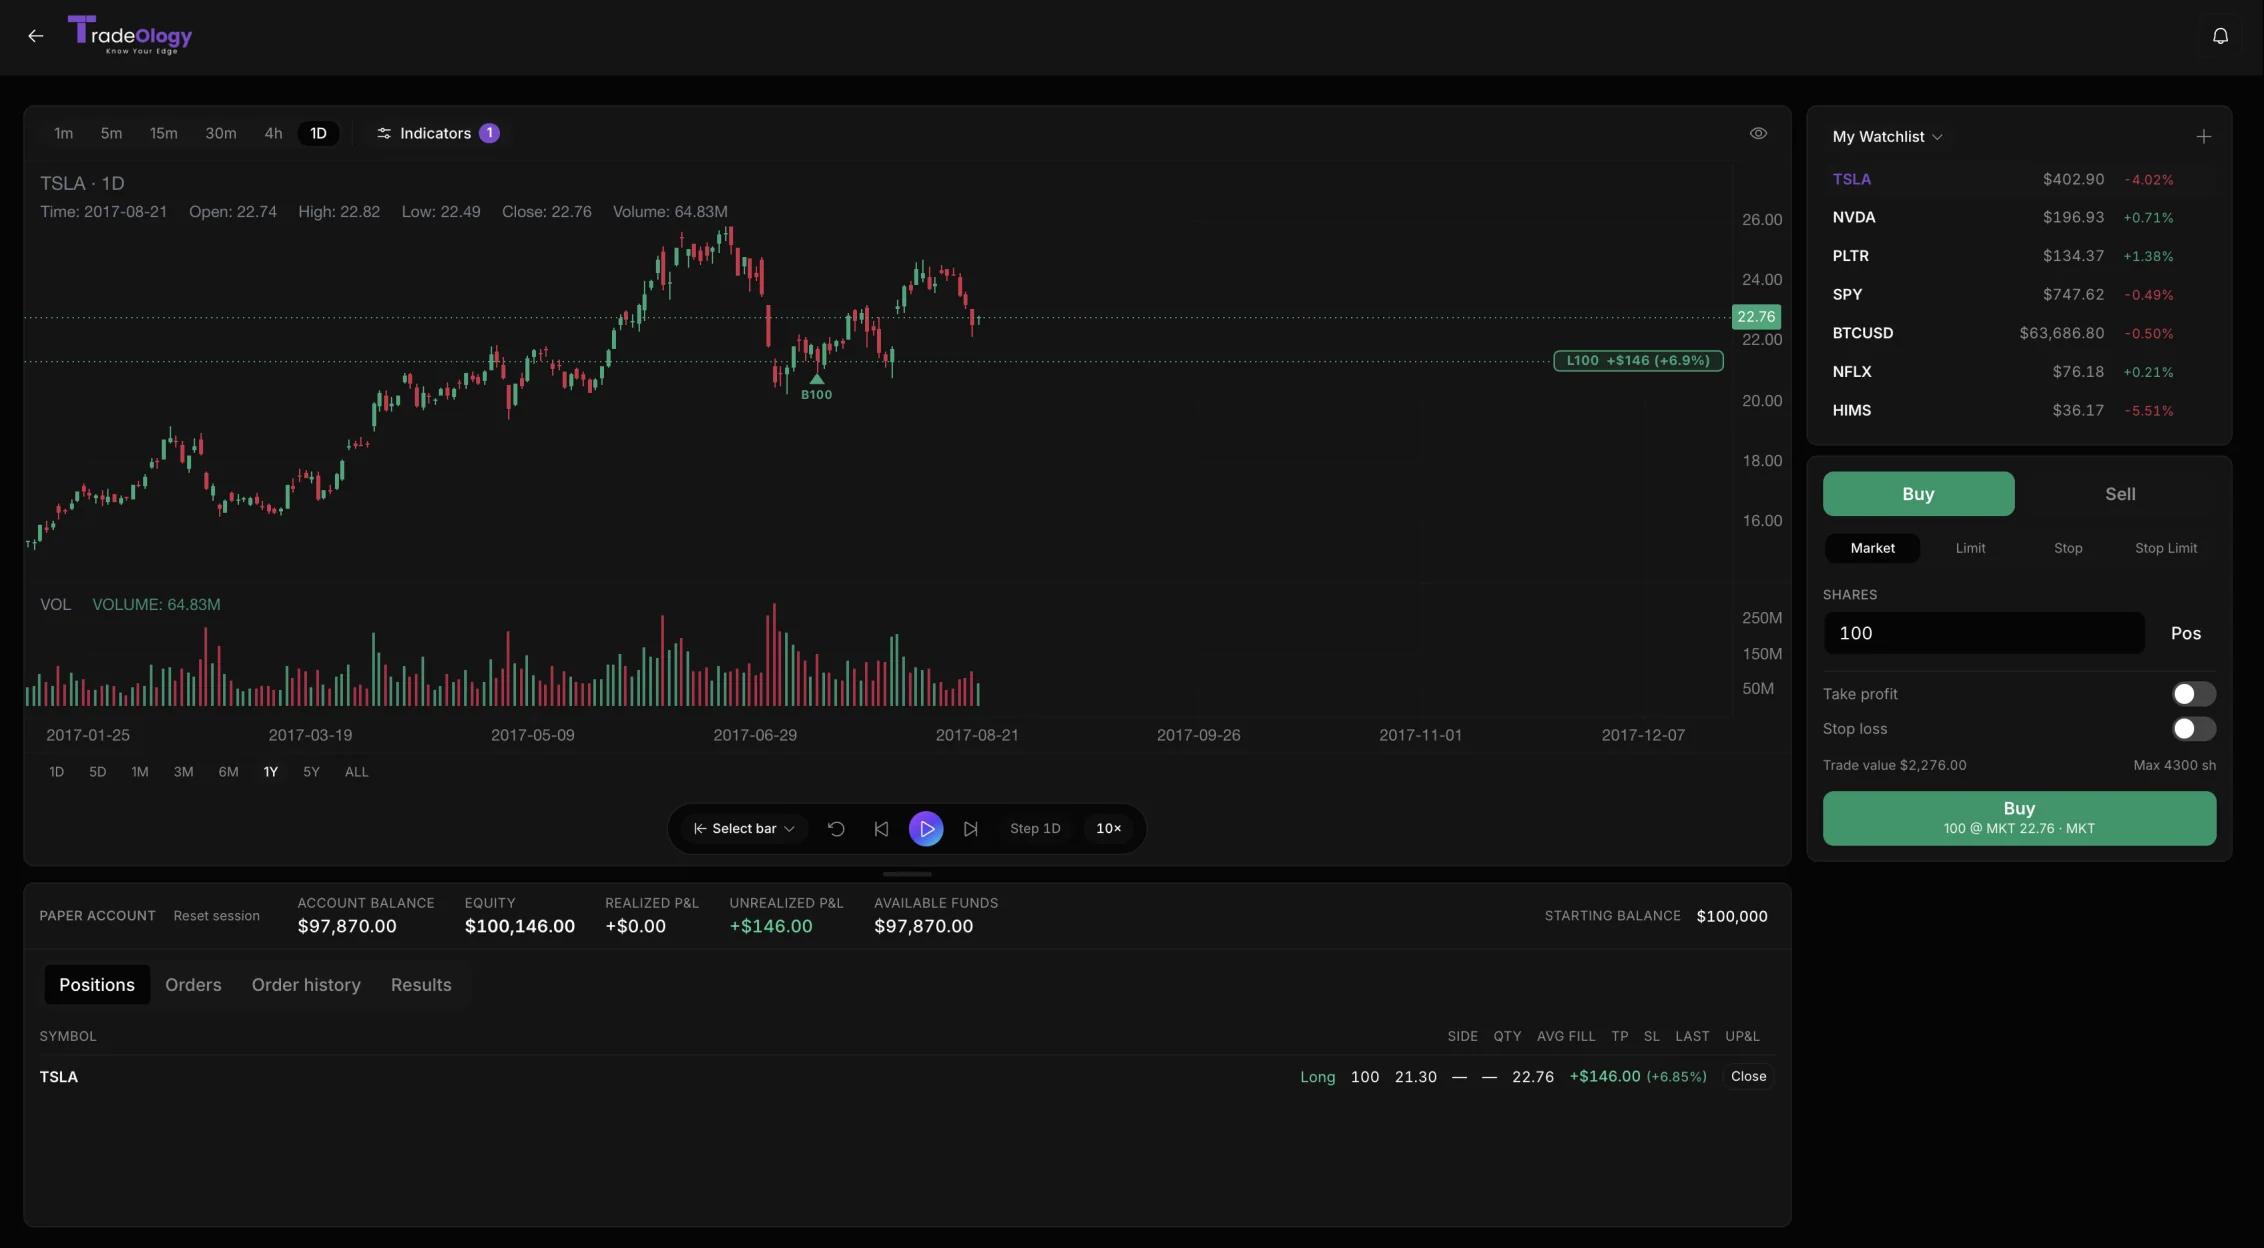
A built-in trade simulator and replay
TradeOlogy ships with a trade simulator most rivals either charge extra for or lack entirely. Load any symbol, replay it candle by candle, and practise your entries and exits on a paper account with a real order ticket - take-profit, stop-loss and all.
Crucially, it never touches your real journal, so you can rehearse a setup or pressure-test an idea risk-free before you put money behind it.
Meet Oly - your AI trading coach
Oly is your AI trading coach that reads your journal for you. It studies every trade you log - your tags, sessions and P&L - then tells you in plain language what's working and what's quietly costing you. No signals, no predictions. Just the truth in your own data.
Instant, honest read: ask "how am I doing?" and get your net P&L, win rate and profit factor in seconds.
Finds your leaks: it surfaces the tags, days and setups that drain the account before you notice them yourself.
Always on your side: a coach that never judges, never gets tired, and remembers every trade you've ever made.
Tax season, handled
TradeOlogy generates tax reports with wash-sale tracking and a Schedule D CSV, so the part of trading everyone dreads becomes a click rather than a weekend. For active traders and options sellers, having accurate, wash-sale-aware numbers ready at year end is a genuine time-saver.
It's the kind of unglamorous feature that most journals skip and that quietly pays for the subscription on its own.
A free academy to sharpen the edge
Rounding it out is a free trading Academy - structured lessons on risk, psychology and strategy, from first principles through to refining your edge. It gives the analytics context: the reports show you what's happening, and the Academy helps you understand why and what to change.
For newer traders especially, having education sitting alongside the journal shortens the feedback loop that normally takes years.
TradeOlogy pricing (2026)
TradeOlogy's pricing is the most generous in our roundup. You can journal free forever with no trial clock, and the paid Pro tiers - which add live broker auto-sync - start at $15/month with a 7-day free trial and no long-term commitment.
TradeOlogy pros and cons
What we liked
- Auto-syncs from 25+ brokers, plus CSV import from any broker
- Genuinely free forever tier - full analytics, no trial clock
- Build-your-own dashboard + six report categories (risk, time, tags, symbols, cashflow, performance)
- Built-in Trade Simulator / replay to test setups risk-free without touching your real journal
- Handles stocks, options, futures and crypto in one journal
- Tax reports with wash-sale tracking and a Schedule D CSV
- "Oly" assistant answers metric questions from your own journal - no signals, no fluff
- Free Academy with structured lessons on risk, psychology and strategy
Where it falls short
- A newer name than TradeZella or Tradervue, so a shorter public track record
- 25+ direct broker connections - fewer raw integrations than TraderSync's list (CSV covers the rest)
Who TradeOlogy is for
A good fit if…
- Active stock, options, futures and crypto traders who want everything in one journal
- Anyone who wants pro-grade analytics without a pro-grade price tag
- Day traders who need automatic import because manual entry can't keep up with the volume
- Traders who want to practise setups risk-free with a built-in simulator
- Beginners who want a genuinely free tool with room to grow
- Options traders and higher-volume accounts who need wash-sale-aware tax reports
Look elsewhere if…
- Traders whose broker is unusual enough that they need one of the very largest raw integration lists (TraderSync connects to more)
- Buyers who specifically want the longest public track record and biggest community (TradeZella has been around longer)
- Anyone who wants a purely offline, desktop-installed journal rather than a cloud platform
TradeOlogy alternatives and comparisons
TradeOlogy is the benchmark the rest of this list is measured against. It matches the core of pricier tools like TradeZella - broker auto-sync, deep analytics, a customizable dashboard and a trade simulator - at roughly half the monthly cost, and its free tier is the most capable we tested. For most traders, that combination of features and value is simply hard to beat.
Where rivals can still edge it: TraderSync's raw broker-integration list is longer, and TradeZella has a longer history and a larger community. But on the metric that matters most - how much genuinely useful journaling and analytics you get per dollar - TradeOlogy comes out ahead, which is why it holds our number-one spot for 2026.
Free Trading Journal Template
Track your trades, analyze performance, and improve your strategy. Enter your email to get the free spreadsheet.
No spam. Just the template link.
TradeOlogy - FAQ
How much does TradeOlogy cost?
It's free forever for manual entry and CSV import with the full analytics suite. Paid Pro plans, which add live broker auto-sync, start at $15/month ($12/month billed annually), with a Pro Advanced tier at $25/month. There's a 7-day free Pro trial and you can cancel anytime.
Which brokers does TradeOlogy support?
It auto-syncs with 25+ brokers and covers everything else through CSV import, so you can bring in a complete trade history from virtually any broker.
What markets can I journal in TradeOlogy?
Stocks, options, futures and crypto - all in a single account, with multi-leg options grouped correctly and per-strategy analytics across every asset class.
What is Oly?
Oly is TradeOlogy's AI trading coach. It reads your own journal - your tags, sessions and P&L - and explains in plain language what's working and what's costing you. It doesn't give signals or predictions; it just surfaces the truth already in your data.
Is there a free version of TradeOlogy?
Yes. The free forever tier includes the full analytics dashboard, all six report categories, the notebook, strategies and the Academy, with no trial clock and no card required. You only pay if you want live broker auto-sync.
Does TradeOlogy help with taxes?
Yes. It generates tax reports with wash-sale tracking and a Schedule D CSV, which is a real time-saver for active traders and options sellers at year end.